If you leverage the local tracking methods of the Advanced Ads Tracking add-on, effortlessly sharing ad impressions and clicks with advertisers becomes a breeze. You can furnish them with a link to the non-indexed public statistics or set up an automatic email report.
However, what if you’re tracking your ads using Google Analytics instead of the local methods?
Enter this tutorial, designed to guide you through crafting custom reports in Google Analytics 4 and sharing these insightful ad statistics with your valued clients. Let’s dive into the details.
Table of Contents
Set up the ad tracking with Google Analytics
To meticulously track and oversee your ad statistics through Google Analytics, kickstart the process by selecting Google Analytics as your preferred tracking method within Advanced Ads. For this task, navigate to Advanced Ads > Settings > Tracking and insert one or more Google Analytics tracking IDs.
Once done, you only need to create a custom dimension in your Google Analytics account, and clicks and impressions of your ads will populate the event section of your Google Analytics dashboard.
For a step-by-step guide on setting up Google Analytics tracking, refer to our dedicated tutorial for configuring Google Analytics.
Craft tailored ad reports in Google Analytics 4
When utilizing a Google Analytics 4 property for your tracking needs, the backend interface looks slightly different, and you will find your data located in a section other than in Universal Analytics.
To initiate the creation of an ad report, head over to Reports > Engagement > Events. Here, you’ll encounter a list of all recorded events, not limited to those specifically tied to your ads.
Fear not; customization options abound, allowing you to tailor and share this data based on your unique requirements.
Refine results for individual ads
To focus on the performance data of specific ads within a report, simply click the ‘Add a Filter’ button. This action opens up customization options on the right side of the screen.
In the Include tab, opt for the dimension Custom > Advanced Ads. Subsequently, under Dimension Values, use the dropdown to select the specific ads for which you want to map performance data in your report.
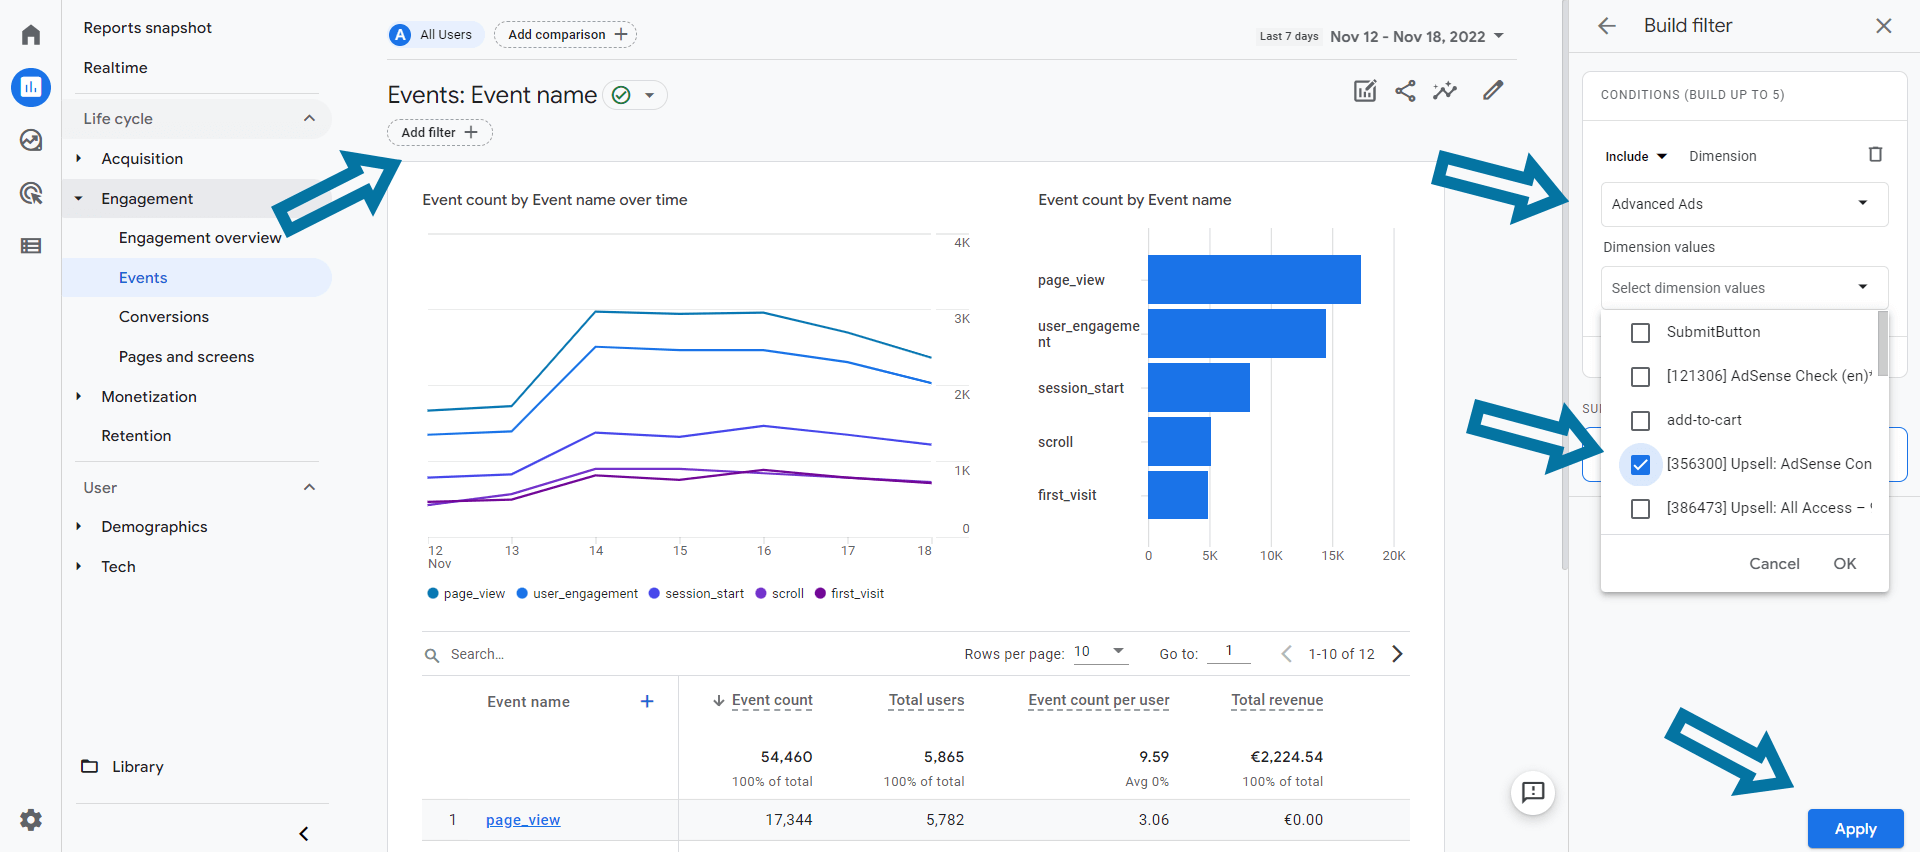
Once you have made your choices, hit the Apply button to save the filter. The report will then refresh, displaying only events tied to Advanced Ads, with the data now honed in on the selected ad units.
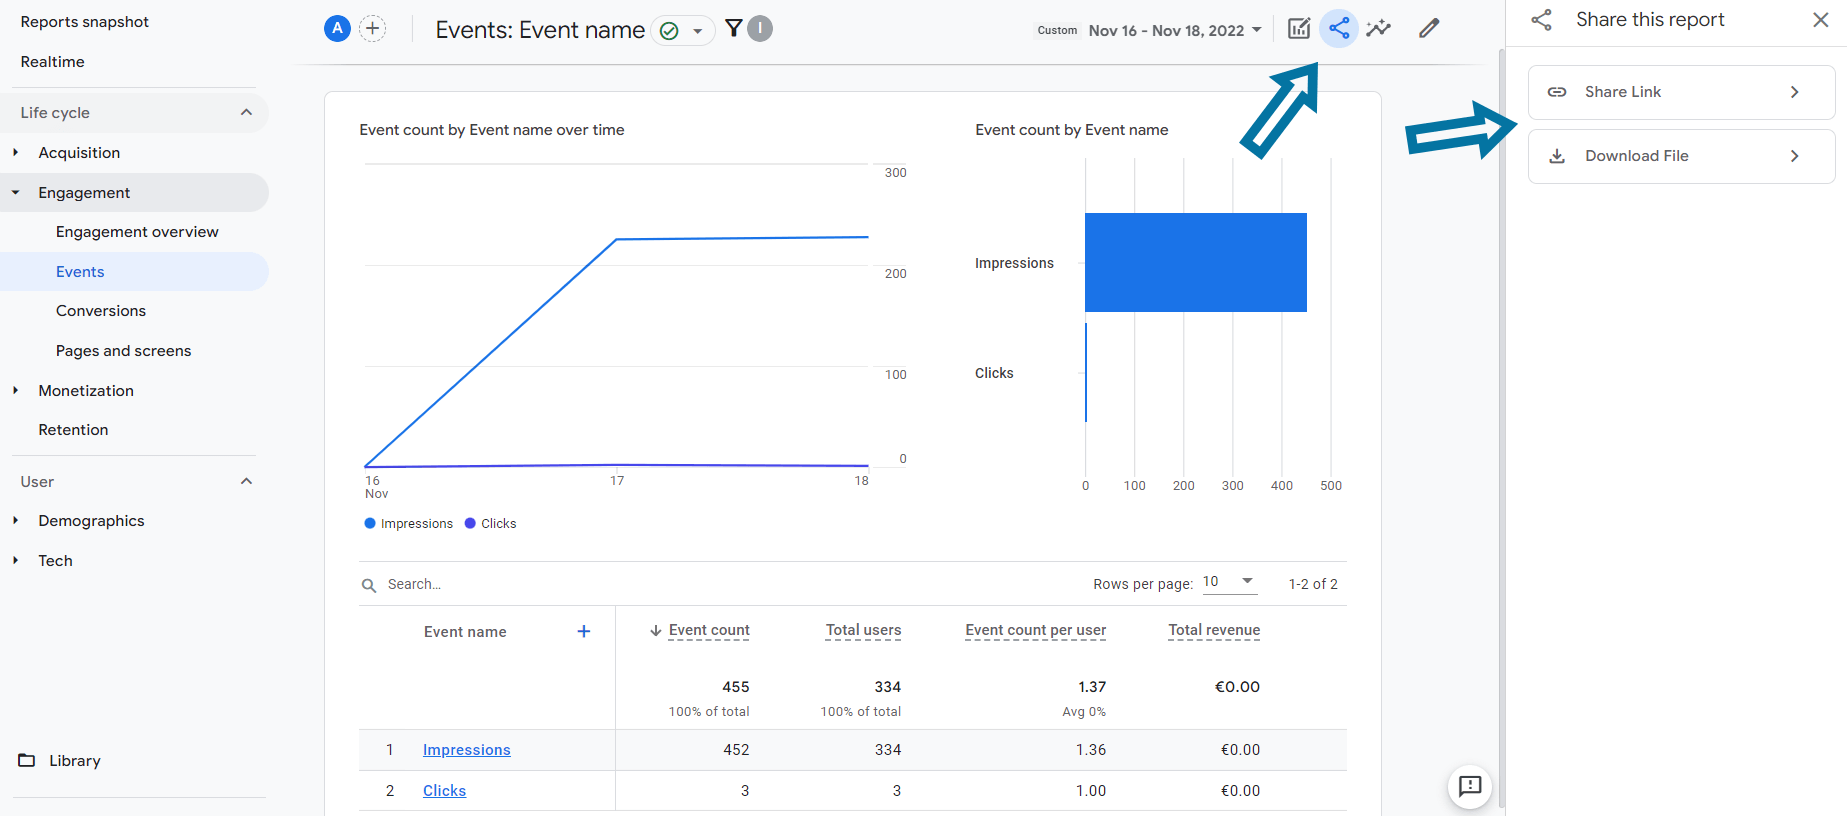
Share Google Analytics 4 reports
While Google Analytics 4 doesn’t offer the automatic email report feature found in Universal Analytics properties, fear not—alternative sharing methods abound.
Click on the share icon on the screen’s upper right side. Here, you’ll find the option to generate a direct link to share with your customers easily. It’s important to note that your customers must have access to your property to open this link.
Alternatively, you can download the report as a CSV or PDF file, allowing you to send it to your customers conveniently through other means.